Retail ERP Data Platform
A simulated retail enterprise data platform demonstrating the journey from operational transactions to analytics-ready dimensional models.
Context
Retail businesses generate data across sales, customers, products, inventory, purchasing, and finance. The challenge is not simply storing those records. It is connecting them well enough to answer business questions consistently.
A question such as Which products are driving revenue? may depend on sales transactions, product classifications, store information, returns, and time. Inventory reporting introduces a" different problem: the business needs to understand not only what was sold, but what was available, moved, received, or adjusted.
This case study explores how operational retail data can be organized around those analytical needs.
About the project
The project uses Python, PostgreSQL, Databricks, dbt, and SQL to simulate the journey from operational transactions to business-ready datasets. The technical architecture is important, but the focus is on a broader question:
How should data be structured so that reporting reflects how the business actually operates?
Approach
The work starts with business questions rather than source tables.
Before defining dimensions, facts, or transformation layers, I identified the types of analysis a retail team would need to perform:
- sales performance
- customer behaviour
- product performance
- inventory movement
- purchasing activity
- financial reporting
From there, I worked backwards to determine:
- Which operational records were required?
- How those records related to business concepts?
- Where definitions needed to be standardized?
- Which events should be measured as facts?
- Which entities should provide analytical context?
This led to a layered data model that separates operational data processing from business-facing analytics. I used a medallion-style architecture to separate source preservation, data standardization, and business-facing modeling.
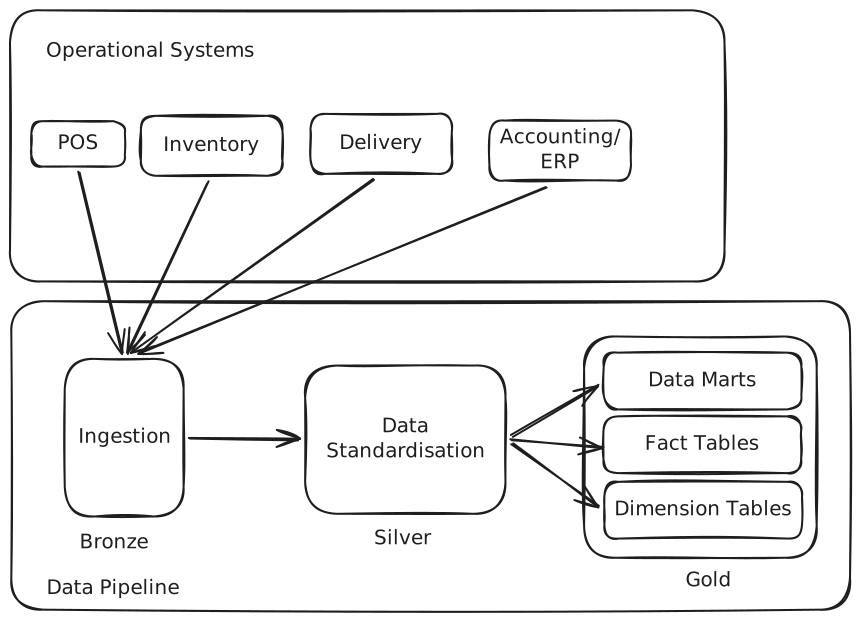
PostgreSQL represents the source system. Databricks is used to ingest, clean, and standardize operational records. dbt then organizes those prepared datasets into dimensions, facts, and reporting models.
The purpose of this separation is not architectural complexity for its own sake. Each layer addresses a different business risk:
- preserving source data supports traceability.
- standardizing records reduces inconsistent interpretation.
- reusable business entities prevent duplicated logic.
- dimensional models make reporting easier to understand and maintain.
The technical design therefore follows the analytical intent of the platform, rather than the other way around.
Methodology
Several design principles were applied across the platform.
Preserve business time
Retail data is inherently temporal. A transaction occurs at a point in time, but products, customers, prices, inventory positions, and other business entities can change.
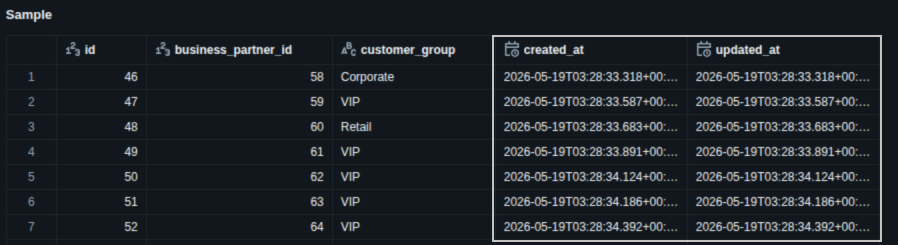
Temporal attributes are therefore introduced and preserved across the pipeline so that analytical models can distinguish between when an event occurred and when a record was processed.
This supports more reliable historical analysis and makes changes easier to trace across layers.
Define expectations between layers
Each layer has an expected structure and responsibility.
Schemas, required fields, data types, identifiers, and quality rules are treated as contracts between upstream and downstream datasets.
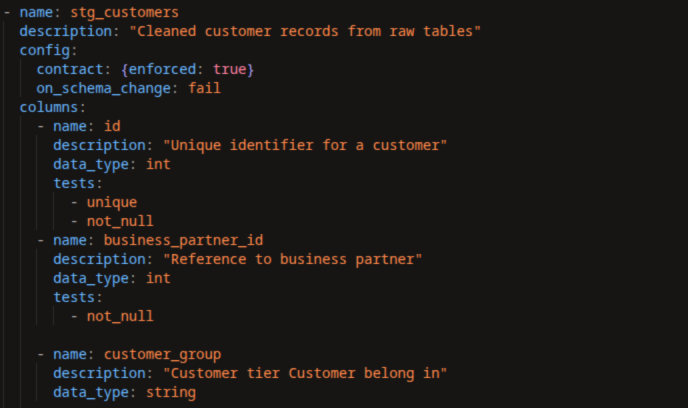 Snippet of data contract yaml configuration file.
This reduces ambiguity about what a dataset represents and helps prevent changes in one layer from silently altering reporting logic elsewhere.
Separate data preparation from analytical modeling
Databricks is used to prepare reusable, source-aligned datasets within the lakehouse.
dbt is used to express analytical transformations in SQL and organize those datasets into dimensions, facts, and reporting models.
The separation allows data preparation and business modeling to evolve independently while maintaining clear dependencies between them.
Model business processes explicitly
The Gold layer is organized around measurable business activity rather than the structure of the source database.
Events such as sales, inventory movements, and purchasing activity become candidate facts, while entities such as customers, products, stores, and dates provide analytical context.
This makes the reporting model easier to align with the questions the business is trying to answer.
Outcome
The result is a simulated retail data platform that connects operational activity to a more coherent analytical view of the business.
Traceability of data from source to report with lineage graphs.
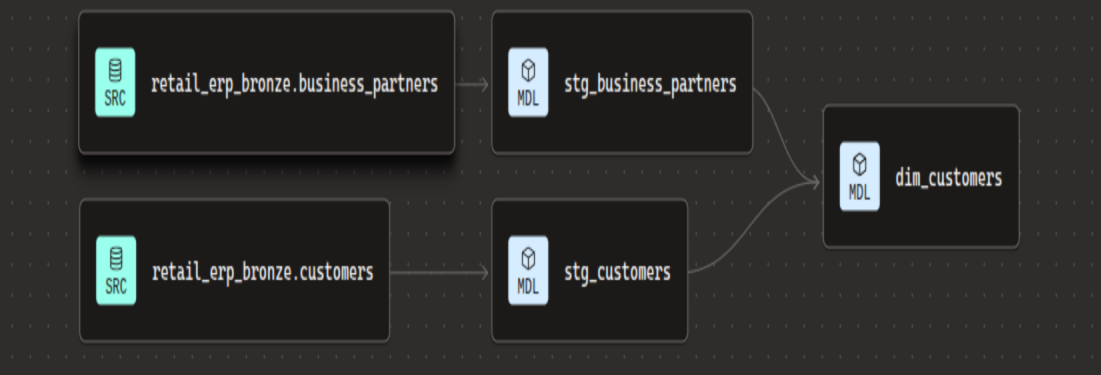
The lineage graph makes those dependencies visible. Rather than treating a metric as an isolated calculation, it shows the chain of definitions, transformations, and source data required to produce it.
This improves the ability to answer questions such as:
Where did this metric come from? Which source records contribute to it? Which transformations changed the data? What downstream reporting would be affected by a model change?
The project demonstrates how data architecture decisions influence reporting quality. A customer, product, transaction, or inventory movement must be defined consistently before it can support a reliable metric.
More broadly, the case study reflects how I approach data work: start with the business question, understand the operational process behind the data, and then use technical tools to create a structure that makes analysis more trustworthy.